It is important, for all courses, to ensure accessibility of electronic course materials. ITMAT Education created the below checklist to help faculty quickly create and revise course materials with accessibility in mind.
Below are multiple levels for accessibility screening. We recommend starting with Level 1. Once your materials have been updated to Level 1 Accessibility, you might consider adding additional accessibility measures.
It's always easier to design accessible content from the beginning, rather than to edit materials retroactively. We recommend revisiting this page or consulting with ITMAT Education staff before creating new course materials so you can have these guidelines at the top of your mind.
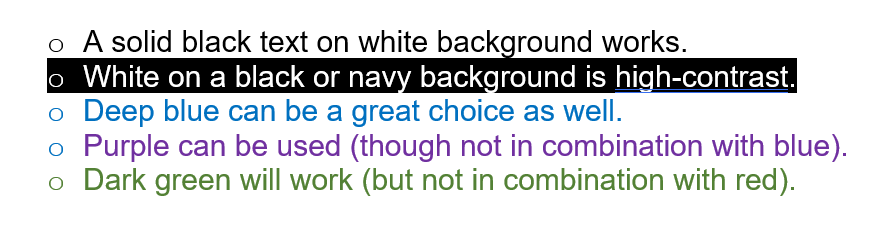
Make sure your font and background color choices are accessible.
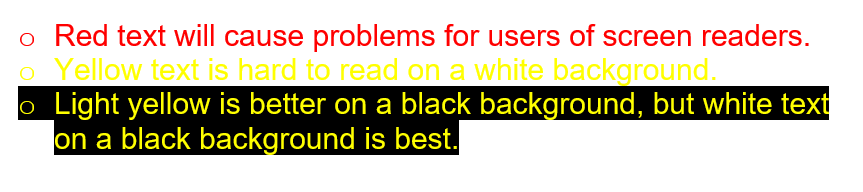
Avoid red text and other difficult-to-read text colors
Red may be a Penn color, but it is incompatible with screen readers and can present issues for audiences with colorblindness.
DO: Use blues, blacks, or other dark colors for text.
DON’T: Use red, yellow (on white backgrounds), lighter colors in general, or use color alone to differentiate important information.
To differentiate one concept from another concept, don’t use color combos that colorblind people can’t see. (Such as: red/green, green/brown, blue/purple, green/blue, blue/gray, etc.)
This also goes for figures and graphs. Avoid using these color combinations for line graphs, bar charts, pie charts, and other figures.
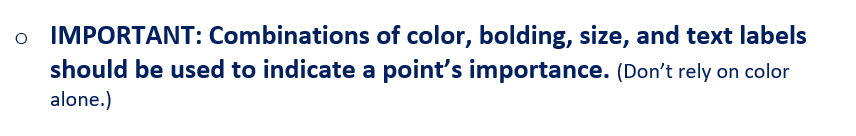
Avoid highlighting text or relying on color alone for emphasis
As discussed above, there are many accessible ways to create emphasis for certain information.
DO: Use size, bolding, or color (in combination) to emphasize text. Also consider using labels or text markers that can be read by a screen reader or recognized without color cues.
Ideally, use other cues in addition to color to differentiate graphics or important words (such as size, boldness, text labels, and patterns in figures). Below, patterns are used in a figure to differentiate in addition to color.
DON’T: Use red, yellow (on white backgrounds), lighter colors in general, poor-contrast highlight, or color by itself to differentiate important information.
Text that is only highlighted or only color-coded will not necessarily be emphasized for people who use screen readers or who are colorblind. Use multiple markers of importance.
Alternative text is a type of invisible caption for images or figures. Hidden from average users, alternative text assists people with vision impairments, those who use screen readers, and learners with other types of disabilities. It also helps everyone with context and interpretation of images and figures.
Image descriptions
Whenever you use an image, you may right-click (or cmd-click) and select “Edit Alt Text” to supply a description.
For example, in a course unit that discusses researchers’ engagement with study subjects…
DO: Use descriptive text that replaces the image, no more than a few sentences, and includes context from the lesson.
Alt text: A clinician discusses study participation details with a parent and child. Their expression is warm.
DO: If an image is for decorative purposes only, mark it as decorative. (Available under the Edit Alt Text menu)
DON’T: Leave the default file name as the alt text, or use vague text without context.
Alt text: Doctor with patients
Alt text: PatientConsult.jpg
No alt text
Figure/chart descriptions
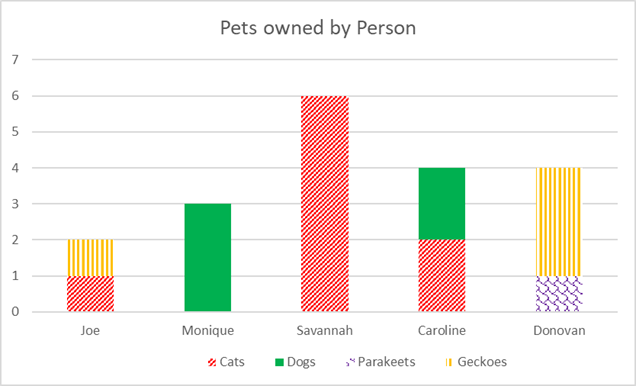
In order to be fully accessible, charts and figures should include text-only descriptions that convey the same data. This will assist visually impaired and color-blind students but can also help clarify meaning for all learners.
DO: Use descriptive text that replaces the table (not just describes it) OR that summarizes the table, with a full description elsewhere.
Alt text: A bar graph indicates the number and type of pets owned by Joe, Monique, Savannah, Caroline, and Donovan. Savannah has the largest number of pets (6 cats). Donovan has 3 geckoes and 1 parakeet. Caroline has 2 cats and 2 dogs. Monique has 3 dogs. Joe has 1 gecko and 1 cat.
Alt text: A bar graph indicates the number and type of pets owned by several people.
Later description in text (not alt text): In the chart above. Savannah has the largest number of pets (6 cats). Donovan has 3 geckoes and 1 parakeet. Caroline has 2 cats and 2 dogs. Monique has 3 dogs. Joe has 1 gecko and 1 cat.
Alternatively, you may focus on the content that is most relevant to the lesson. Alt text: A bar graph shows that Savannah has the most pets (6), Joe has the fewest (2), and three of the pet owners have at least two different kinds of pets.
Consider, also, providing data in simple table formats.
DON’T: Leave the default file name as the alt text, or use vague text without context.
Alt text: Bar graph of pet ownership
Alt text: Bargraph1.png
No alt text
For videos, podcasts, or anything with audio, transcripts or captions are important to make multimedia accessible for people with hearing impairments. Transcripts and captions are also helpful for second-language English speakers, some learning disabilities and learners who prefer to consume information through text.
Zoom includes a live transcription feature. Please turn it on at the beginning of any synchronous course meeting or asynchronous material recording. Learn how to enable Zoom Live Transcriptions here.
Using Zoom to record asynchronous videos/materials will generate captions using Zoom Live Transcriptions above.
Make sure any external videos or audio (not created by you) has captions or a transcript. YouTube videos have automatically generated captions as well.
If you’d like to use a video or audio resource but need help creating captions or transcripts, contact the ITMAT Ed staff team.
Level 2: Accessibility Enhancers
Hyperlink formatting is an important and efficient piece of accessibility.
To make hyperlinks accessible for screen readers and to keep them short and easy to read, apply a hyperlink to text rather than pasting a link directly in a document or page. Make sure the display text is descriptive, not vague.
Web accessibility guidelines also apply to your text and page formatting.
Headings
Use headings in any document or webpage, and make sure to use them in order. Heading text provides important information for users with visual impairments. It also makes the document easier to navigate for everyone!
DO: Use the “Heading 1” style, followed by the “Heading 2” style for sub-sections, and so on, in documents and pages.
Example Page Title: Heading 1
Example Subsection: Heading 2
DON’T: Use “Heading 3” (or another heading) without using Heading 1 or Heading 2 beforehand, even if you prefer the look or feel.
Nonexample Page Title: Heading 4
Nonexample subsection: Heading 2
DON’T: Use heading styles for aesthetics or emphasis.
If you want to emphasize something, you can use bold, **asterisks,** or manually change font size.
Tables
When you use tables in your documents, there are a few things to keep in mind.
DO: Designate a Header Row.
In Word, select the Table Design tab and make sure Header Row is checked.
DON’T: Use tables decoratively or for formatting.
DON’T: Merge table cells.
Person
Cats
Dogs
Parakeets
Geckoes
Joe
1
None
1
Monique
None
3
0
None
Level 3: Course Content
Make sure that readings, resources, and lectures that students need to review before class are provided in a timely manner. Slower readers, students with English as a second language, and mega-planners all appreciate having timely access to course materials.
DO: Post course readings well in advance – ideally at the beginning of a semester, but at minimum 1-2 weeks prior
DON’T: Post readings 1 or 2 days prior to class
Consider your content when building a course, using a variety of content types and representation.
Types of content
Use a variety of resources for your course content, whenever possible. A variety of formats helps keep learners engaged.
DO: Use a mix of articles, websites, videos, PowerPoints, podcasts, etc. whenever possible.
DO: When a resource is available in multiple formats (e.g., a video and a transcript), offer both versions.
DON’T: Stick exclusively to text-based resources or recorded lectures.
Content representation
Clinical and translational research features researchers, workers, and participants from all walks of life and backgrounds. Take care in selecting your content so that it represents many types of experiences and perspectives, across lines of race and ethnicity, class, nationality, sexuality, disability, and other identities.
DO: Include papers written by international authors.
DO: Develop case studies to focus on populations typically excluded from research.
DO: Design a panel discussion with speakers from a variety of backgrounds.
DON’T: Avoid critically evaluating your materials and asking what or who else you could include!
Write clear instructions, expectations, and evaluation criteria when it comes to running the course or submitting assignments.
DO: Go over instructions and expectations in multiple formats.
DO: Post clear directions in writing.
DO: Use rubrics or examples of successful work to be explicit about what’s expected (and when).
DON’T: Only write instructions or expectations in the syllabus.
DON’T: Only talk about assignments in class, without providing written instructions or grading criteria.
Level 4: Course Policies and Design
There are a few strategies you can use to design assignments and assessments that are inclusive, accessible, and more useful for all students.
Low-stakes assignments and scaffolding
Most courses have some kind of “final project” or exam, but you can reduce the stress and increase students’ chances for success by including scaffolding in your course.
You can also create low-stakes assignments. This allows students (and you) to go out on a limb and take intellectual risks. It also helps students engage more frequently with a course.
DO: Build in opportunities to submit a paper draft, a project proposal, an annotated bibliography, or any other proof-of-concept that allows students to feel out whether they’re on the right track for a big project.
DO: Create smaller assignments with low point values so the risk of getting it “wrong” is mitigated.
DON’T: Focus on only a few formal, high-point-value assignments.
Timely and detailed feedback
Positive but constructive feedback builds students’ confidence and addresses any shortfalls early on.
DO: Pair your scaffolded and low-stakes assignments with timely and detailed feedback to let students know whether they’re hitting the mark.
DO: Make clear when students can expect feedback, and how they should incorporate it.
DON’T: Forget to make time to grade and provide comments.
DON’T: Include so many formal assignments that providing timely feedback is difficult to do.
Consider your syllabus and participation policies and other ways you run your course. Sometimes small changes can yield big returns.
What’s in a syllabus?
Some course policies are program-wide (e.g., in ITMAT Education, attendance policies are standard). But you have the power to customize others, such as late policies or communication expectations. “Life happens” to everyone, and students with disabilities are more likely to deal with disruptions to life due to their disabilities.
DO: Be clear about what is and isn’t acceptable in your class regarding late work or communication with the professor and peers.
DO: Consider how flexibility could benefit students and yourself.
DON’T: Adopt rigidity without good reason.
Rethinking participation
When we consider the point of participation, what are you hoping students get out of it? How often a student speaks up in class does not correlate exactly with their mastery of its content.
DO: Think about what you want to accomplish with “participation.” Consider opportunities for participation such as group work, asynchronous discussions, or self-reflection that will give out-of-class opportunities for participation.
DO: Develop a system for assessing synchronous participation that doesn’t rely on your memory alone.
The ACUE Discussion Rubric might provide some ideas for how to create discussion expectations.
DON’T: Forget to be explicit about what “participation” means: whether comments in the chat will suffice, or if synchronous class discussions are weighted more heavily than discussion boards.
DON’T: Assume you will remember how much a student spoke up in class by the end of the semester.